Kawai Nui Marsh: 20th Century Photos, charts and maps
Kawainui was a large inland fishpond in Kailua, Oʻahu. This pond was home to the goddess Hauwahine and the Maka-Lei tree. The tree was said to have the power of attracting fish, especially fine mullet, awa, and ʻoʻopu kuʻia.
Kawai Nui Marsh Master Plan. 1994. City Hall Annex, Honolulu. Comp. Municipal Reference & Records Center.
20th century photos
When Kawainui was being developed and boundaries needed to be set, officials set up a “master plan” for rehabilitation, enhancement, wildlife habitats, and protection. This plan considered the impact of the marsh, tools needed for further development, and price budgets. It was separated with a “Study Area” and “Master Plan Area”. The study area was a designated area where the marsh would be studied to provide insight on how much impact it added to the Master plan. This study area was conclusive with the charts provided below, as it was the sample size of data for better prosperity of Kawainui. Citation: Liu, David C. "Preliminary site investigation, proposed land development, Kawainui Marsh, 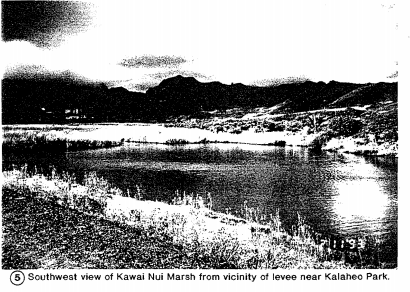
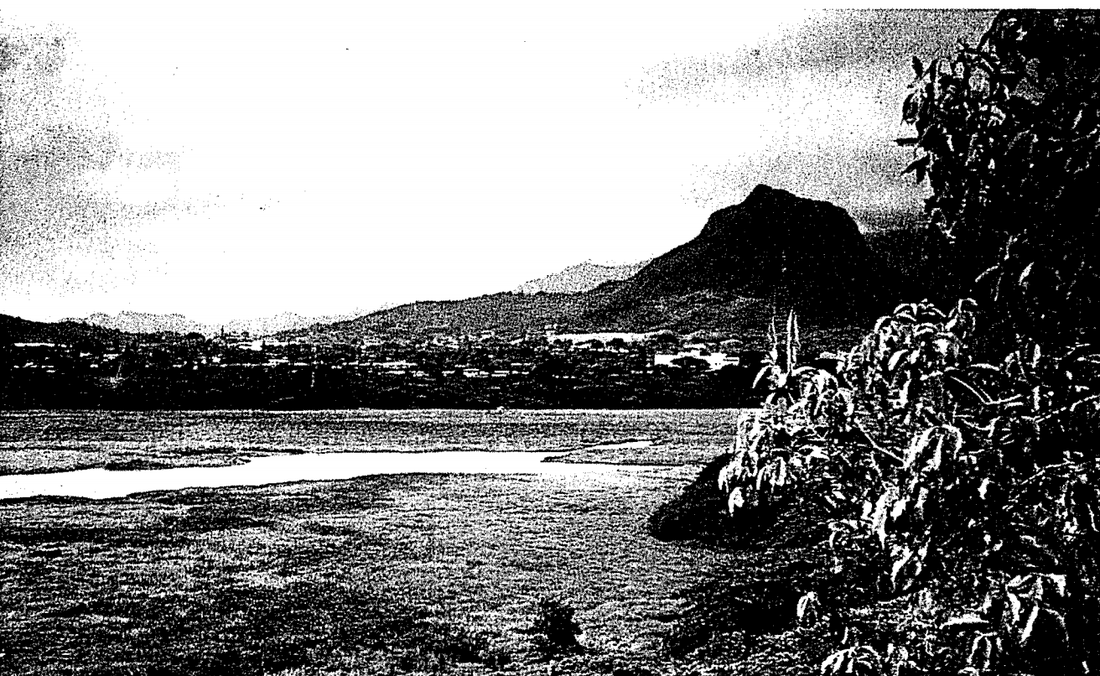
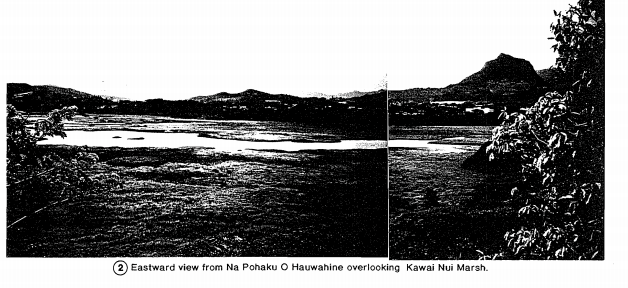
In the image above, the Kawainui marsh is presented in all its glory. This marsh was rich in nutrients, healthy bacteria, and wildlife. In the study area of the marsh, researches conducted a study on the bacteria in the marsh. Not surprisingly, bacteria was more prominent downstream than upstream, and salinity was at 7 parts per thousand due to tidal influence.
Citation: Liu, David C. "Preliminary site investigation, proposed land development, Kawainui Marsh, |
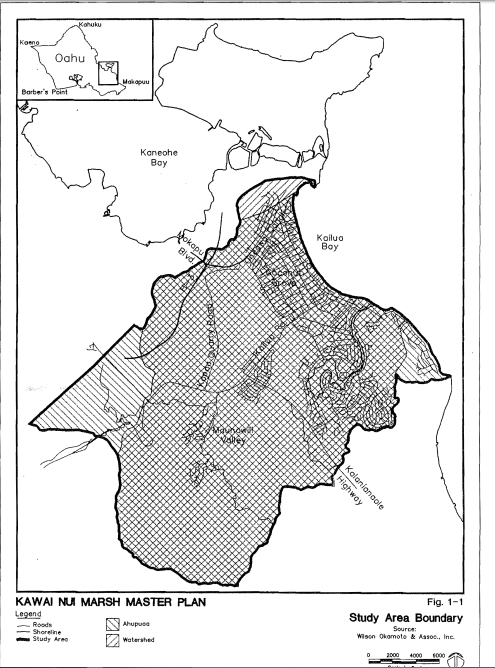
Master plan and Study plan boundaries.
Citation: Wilson Okamoto & Associates, Inc, comp. Kawai Nui Marsh Master Plan. 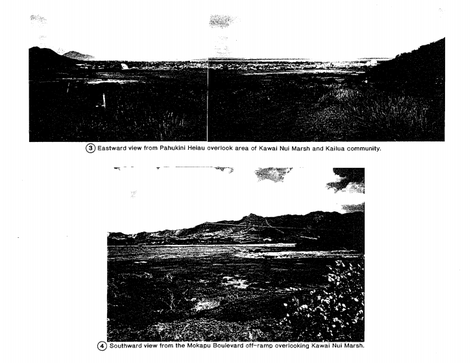
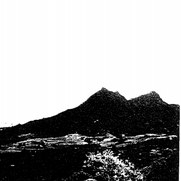
The top images as shown above are the eastern views of the Kawainui wetlands and the bottom is the Southward views. In the 20th century, vegetation in the wetlands of Kawainui mainly consisted of open water plants, california grass, sawgrass, bullrush, and mixed forest vegetation. This included water lettuce, kalo, sugar, bamboo, coconut, banyan, plum, koa, norfolk pine, and additional assortments of plants.
Citation: Wilson Okamoto & Associates, Inc, comp. Kawai Nui Marsh Master Plan. |
The marsh was also found to be rich in sediments due to volcanic geochemistry, and light urban pollution. This included Zinc, Arsenic, Cadmium, Copper, Chromium, Nitrogen, Mercury, and Silver. The heavy metals were concentrated through plant uptake, and in insoluble forms, thus not toxic.
Aquatic life in the marsh was flourishing, including endemic, indigenous and introduced fauna. Endemic species included the following:
Common Name Hawaiian Name
Goby oʻopu nakea
Eleotrid oʻopu okuhe
Flagtail aholehole
Mountain Shrimp opae kalaʻole
Pond Snail opae oehaʻa
Citation: Wilson Okamoto & Associates, Inc, comp. Kawai Nui Marsh Master Plan.
20th century Charts
Charts are a form of data that can help support your claims, petitions, and the like. Charts are important for Kawai Nui, even if their information might not be relevant, because they still give a snapshot of the site when taken.
There are many charts available for the public that are useful when researching about Kawai Nui Marsh. Although spread throughout different resources, each chart is an artifact of the site because it holds a piece of information about the land. Charts are very important for certain aspects of the site such as: data about the environment, graphs for a certain element of the marsh, or even indirect information about the location (percentage of marshlands in Hawaii over time).
There are many different types of charts that can be presented for a given data set. Certain charts are more useful than others for demonstrating a data set than others. An example of this could be a chart about the ratio of Kawai Nui Marsh’s water to land ratio, which would be easily expressed as a pie chart or the like, instead of a bar graph. If there is a piece of data that gives a percentage in different groups (such as have heard of the marsh, not heard of the marsh, or unsure) can be shown as a pie chart, but could be more interesting as a horizontal bar chart. It is important to know how and when to use a chart.
Looking at the different charts presented, we hope to give a sense of how charts can introduce you to the site, further your knowledge of the site, and even help prove a point you are making about the site.
|
Chart A:
Chart A is a simple map and graph of O’ahu, highlighting the island’s wetland percentage before, and after settlers arrived. Although simplified and not directly about Kawai Nui, this chart still gives us insight into the area and island that surrounds Kawai Nui, and can give us more insight into the future of Kawai Nui.
Citation: Van Rees, Charles, and B. Reed. “Wetland Loss in Hawai’i Since Human Settlement.” Wetlands, vol. 34, no. 2, 2014, pp. 335–350. Chart C:
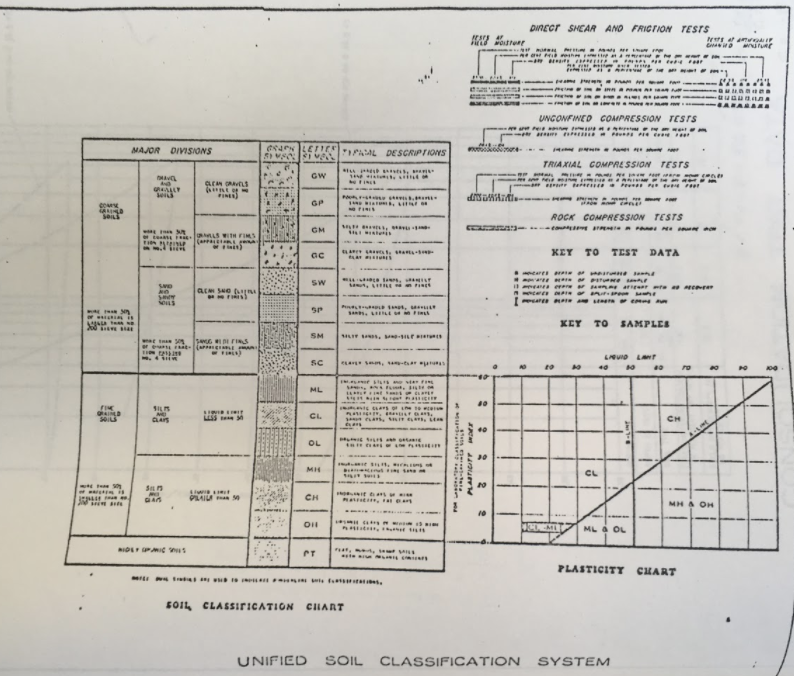
Chart C looks even further into the site Kawai Nui, giving information about the site. These charts were used in a preliminary site investigation led by Dames & Moore, Consultants in Applied Earth Sciences to evaluate how usefulness the land was through its soil, for developing “a residential community community with some commercial and light industrial zones.” This chart if very important for the site because it allows developers to look at the unified soil classification system and determine if this site should be developed over. It gives data on direct shear and friction tests and rock compression tests for Kawai Nui, as well as plasticity charts.
Citation: Liu, David C. "Preliminary site investigation, proposed land development, Kawainui Marsh, Kailua, Hawaii, for the Trousdale Construction Co. : scope : photocopy /". Dames and Moore. Consultants in Applied Earth Sciences. June 1961. HI. Chart F:
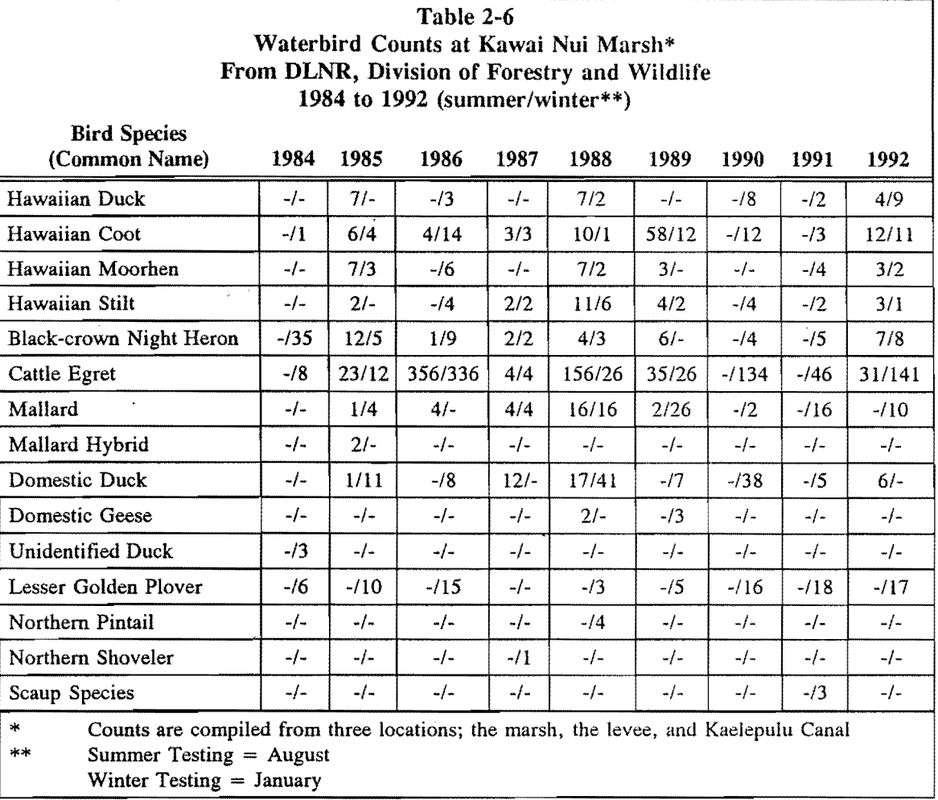
Chart E speaks for itself and is a vital snapshot of the marsh over a decently long period of time. Along with a chart for the different birds that reside in the marsh, along with their scientific name, this chart actually shows the actual sightings of the birds, and shows the change in birds over time. This data can be used in countless ways, and it shows incredibly interesting occurrences like the 350 Cattle Egrets that visited in the summer of 1986.
Citation: Wilson Okamoto & Associates, Inc, comp. Kawai Nui Marsh Master Plan. R-100. Municipal Reference & Records Center, July 1994. Web. Nov. 2017. |
Chart B:
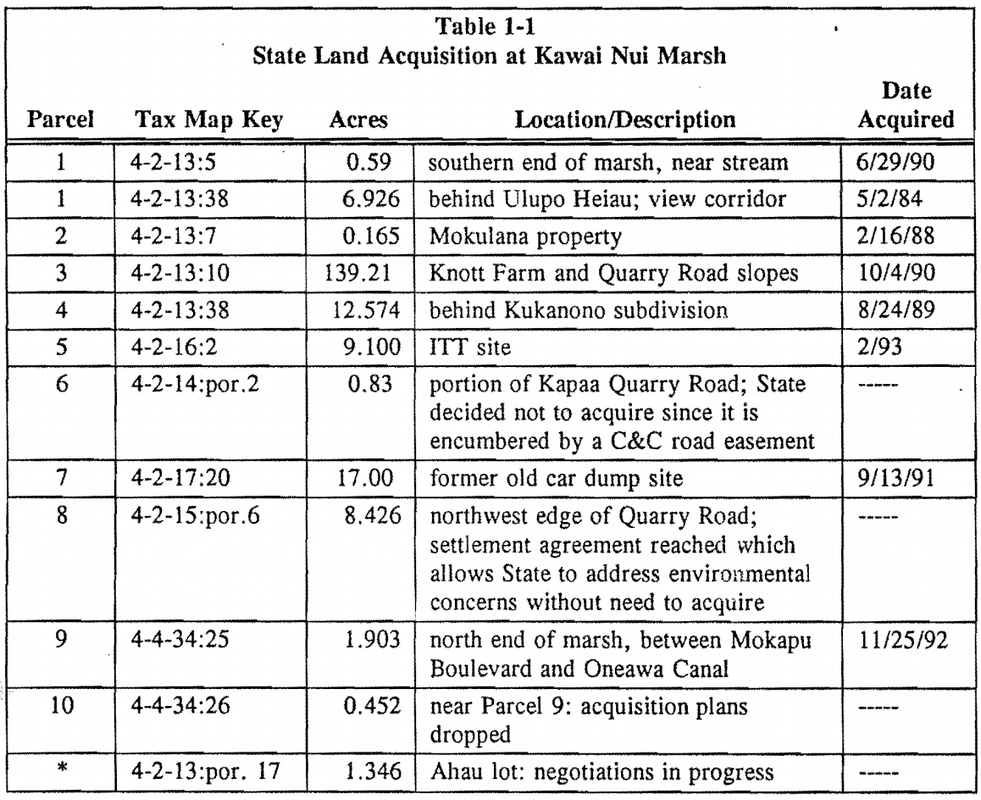
Chart B moves on to look at a table-chart that directly interacts with the site Kawai Nui. Through this chart, we can see the land ownership and descriptions, as well as the date! This interesting piece of data actually looks at the negotiations and concerns of the people that were alive at the time. Through this chart, we can actually understand one of the directional plans for Kawai Nui at the time and perhaps look at how it affected the land.
Citation: Wilson Okamoto & Associates, Inc, comp. Kawai Nui Marsh Master Plan. R-100. Municipal Reference & Records Center, July 1994. Web. Nov. 2017. Chart D:
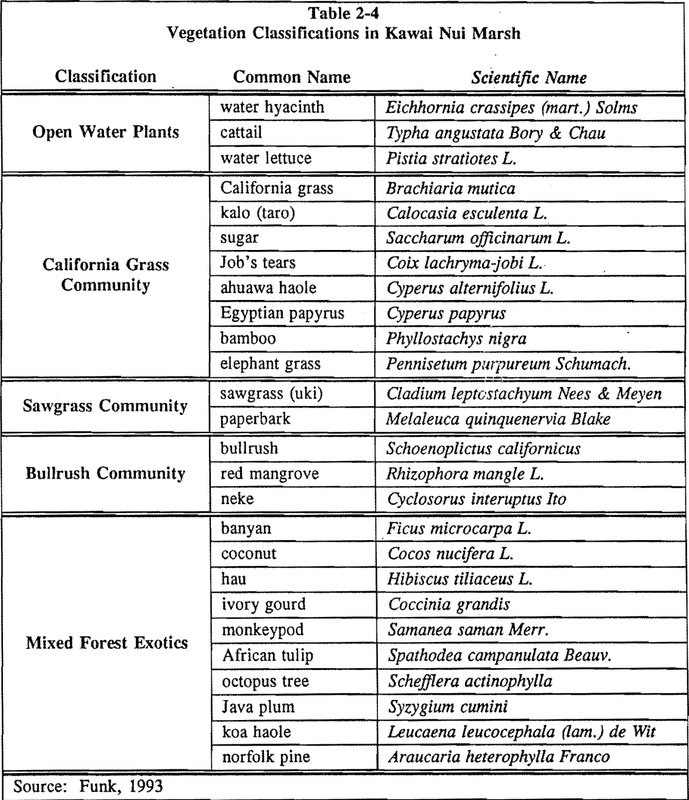
Chart D is a table that shows the vegetation classifications for Kawai Nui Marsh plants. This is very interesting and important to note because it gives a sense of all the different types of invasive species, as well as the native plants. This information could be important to show landscapers because plants like water hyacinth and water lettuce, which are found in open water areas in the marsh, are known to clog waterways and encroach into native wildlife habitats. A quick example of an additional use of this chart is caretakers and owners can come up with solutions for these plants without even having to go to the site and prepare beforehand on how to deal with them.
Citation: Wilson Okamoto & Associates, Inc, comp. Kawai Nui Marsh Master Plan. R-100. Municipal Reference & Records Center, July 1994. Web. Nov. 2017. |
20th century Maps
Citations:
1. Image Citation: United States Geological Survey. Complex. 1951. Kailua. Kawainui-Hamakua Complex Master Plan. Web.
2. Image Citation: Kawai Nui Marsh Master Plan. 1994. City Hall Annex, Honolulu. Comp. Municipal Reference & Records Center.
3.Wilson Okamoto & Associates, Inc, comp. Kawai Nui Marsh Master Plan. R-100. Municipal Reference & Records Center, July 1994. Web. Nov. 2017.
4. Van Rees, Charles, and B. Reed. “Wetland Loss in Hawai’i Since Human Settlement.” Wetlands, vol. 34, no. 2, 2014, pp. 335–350.
5. Liu, David C. "Preliminary site investigation, proposed land development, Kawainui Marsh, Kailua, Hawaii, for the Trousdale Construction Co. : scope : photocopy /". Dames and Moore. Consultants in Applied Earth Sciences. June 1961. HI.
6. Agag, Chantelle. Photograph of Kawainui Marsh. Ua Kualau, 18 Nov. 2017
7. Agag, Chantelle. Photograph of Kawainui Marsh with a different view. Ua Kualau, 18 Nov.
8. Awai, E. L., Fujimura, F. N., Kuwahara, I., and Murabayashi, E. T. Mokapu Quadrangle. Map. 1: 24,000, Topo (LSB). Land Study Bureau, University of Hawaii, 1936.
9. Bier, James Allen. Map of Oʻahu, the gathering place: full color topographic / cartography by James A. Bier. Honolulu: University of Hawaiʻi Press, 2007.
10. Covington, Richard, and Lyons, C. J. Oahu. Map. 1:90,000, color lithographed map. 1881.
11. Donn, John M., and Wall, Walter E. Oahu. Map. 1:90,000, color lithographed map. 1902.
12. Frazier, A. G., Giambelluca, T. W., Diaz, H. F. and Needham, H. L. (2016), Comparison of geostatistical approaches to spatially interpolate month-year rainfall for the Hawaiian Islands. Int. J. Climatol., 36(3), 1459-1470. doi: 10.1002/joc.4437
13. Geological Survey (U.S.) Mokapu Quadrangle. Map. 1: 24,000, Topo (USGS). U.S. Geological Survey, 1998.
14. Giambelluca, T.W., Q. Chen, A.G. Frazier, J.P. Price, Y.-L. Chen, P.-S. Chu, J.K. Eischeid, and D.M. Delparte, 2013: Online Rainfall Atlas of Hawai‘i. Bull. Amer. Meteor. Soc. 94, 313-316, doi: 10.1175/BAMS-D-11-00228.1.
15. McLaughlin, Sean. “Hauwahine’s Dream Story.” Hauwahines dream, produced and written by Linda Lembeck, Kawai Nui Heritage Foundation, 1985, http://reservesvod.library.manoa.hawaii.edu/video/?filename=Hauwahines_dream.
16. Nishimura, Cora. A carto-bibliography of pre-1900 maps in the Map Collection of Hamilton Library, University of Hawaiʻi. 1996.
17. Sterling, Elspeth P., Summers, Catherine C., and Bernice Pauahi Bishop Museum. Sites of O'ahu. Dept. of Anthropology, Dept. of Education, Bernice P. Bishop Museum, 1978.
18. U.S. Army Corps of Engineers, U.S. Coast and Geodetic Survey, Geological Survey (U.S.), and United States. Army. Air Corps. Mokapu Quadrangle. Map. 1:20:000, Topo (COE). War Department, 1936.
19. Winne, Jane Lathrop, and Mary Kawena Pukui. 'Olelo No'eau a Ka Hawaii: Folk Sayings from the Hawaiian. The Author, 1961.